ParkOps System
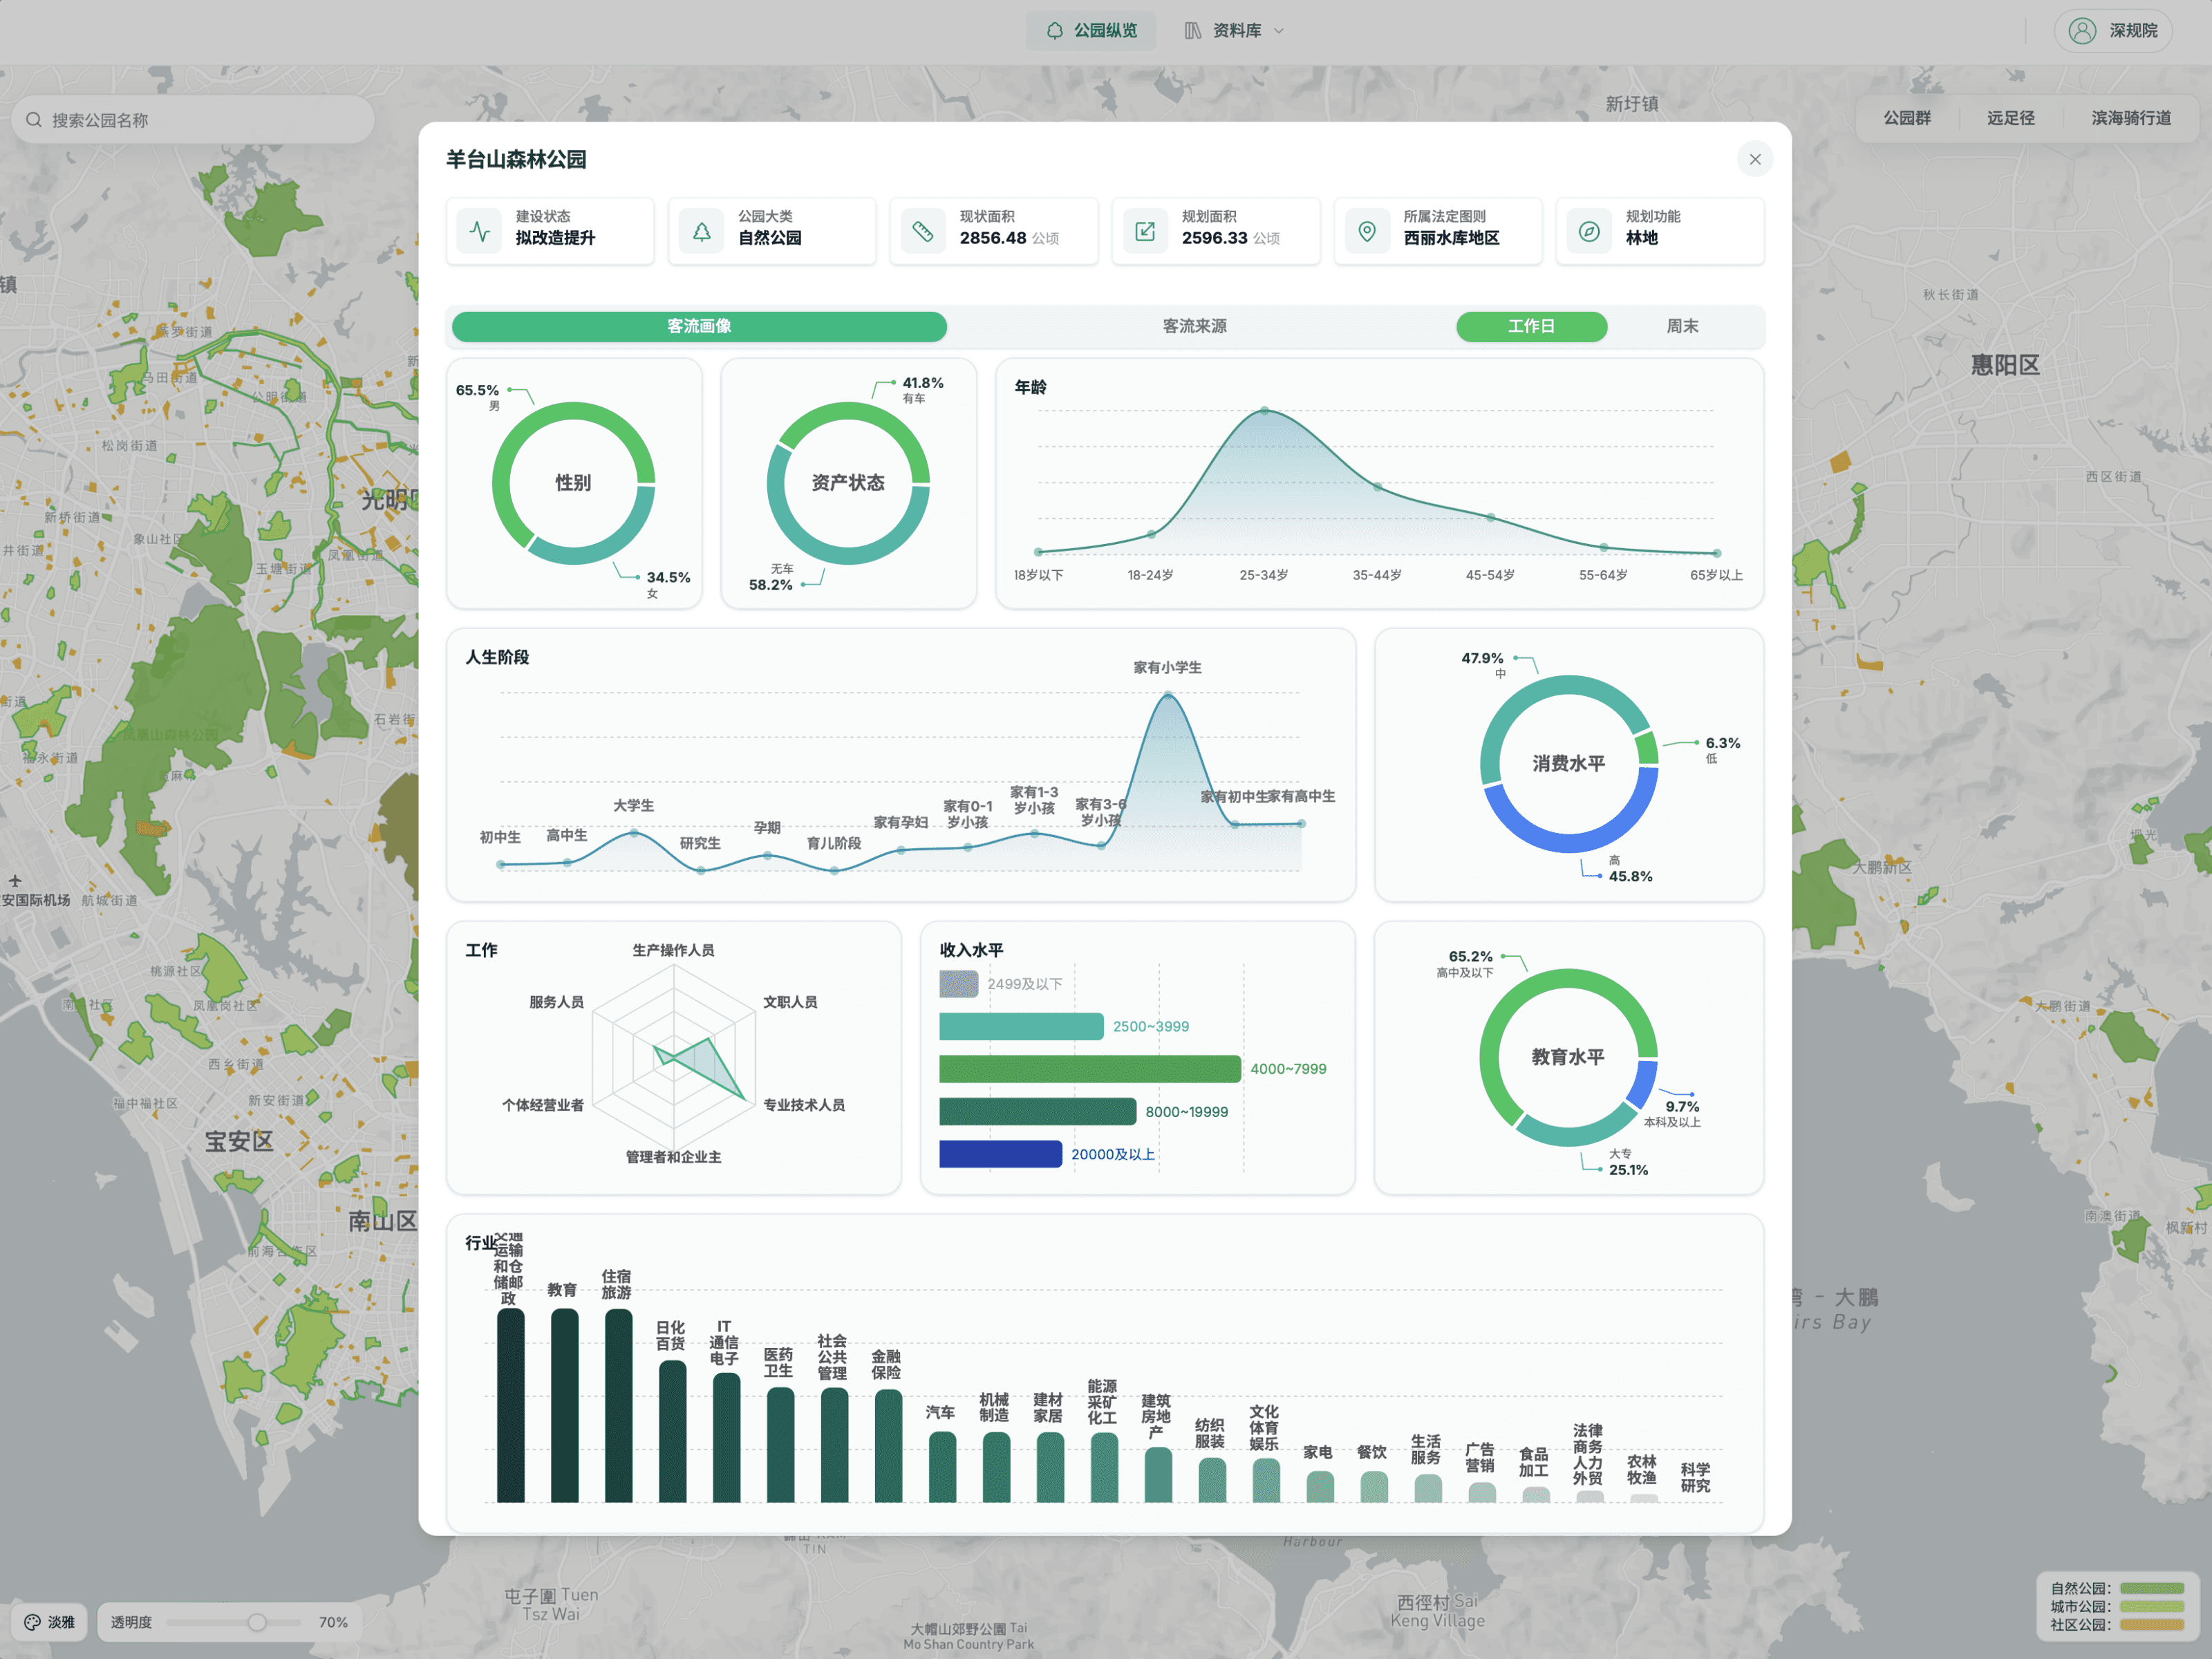
The Park Operations Intelligence Platform is a data-driven system that helps city operators understand and manage urban parks more effectively. Through an interactive city map, users can select any park to view real-time analytics such as footfall trends, demographics, consumption power, and visitor profiles. By centralizing key insights into clear visual dashboards, the platform supports smarter decisions in park planning, resource allocation, and service optimization—enhancing overall operational efficiency.
Client
A municipal government agency
Duration
3 Months | 2024
UX/UI Design | System Development
Tools & Stack
Figma, React, Tailwind
Data-Driven Spatial Exploration
The platform can let users seamlessly explore three major outdoor route types across Shenzhen—Park Clusters, Hiking Trails, and Coastal Cycling Routes. Each route category is visualized with distinct mapping layers, allowing users to compare spatial patterns, understand environmental context, and navigate citywide green resources with clarity. Through integrated GIS data, route filtering, and adjustable transparency controls, the interface transforms complex geographic information into an intuitive, highly legible exploration experience.

Adaptive Search & Intelligent Map Zoom
The platform also features an intelligent, real-time search that dynamically highlights all parks matching the user’s input. As characters are typed, every park whose name contains the entered text flashes on the map, with results updating instantly. The map auto-adjusts its zoom level based on the distribution of matches—zooming in when only a single park fits the query, and zooming out when multiple parks across the city or suburban districts match—ensuring all relevant parks remain fully visible in the viewport. This creates a fluid, responsive search experience that seamlessly connects text input with spatial context.

Origin-Based Flow Visualization
When viewing a specific park, the platform also reveals where visitors are coming from through an intuitive flow-line map and ranked TOP 10 source districts. Each source region is interactive—clicking an item instantly zooms the map to that district, allowing users to examine visitor distribution and inflow patterns with precision. This creates a seamless bridge between quantitative rankings and geographic context, making park-level mobility insights easy to interpret and act on.

Outcome
The origin-flow visualization distills complex mobility data into clear geographic insights, enabling operators to instantly understand visitor inflow patterns and make more informed, strategic decisions for park planning and management.